“How many people came through the gate last year?” sounds like the easiest question a board member can ask. In Altru it often takes a day to answer. The data isn’t missing. The problem is that “attendance” means three or four different things in Altru, and each one is stored in a different place.
Before you build a single report, decide what you’re counting. After that, the queries are fairly simple.
Decide what “a visitor” means at your organization
Altru records sales, admissions, and membership activity, and each can produce its own visitor number. These are the usual candidates:
- Tickets sold. General admission and timed tickets from daily sales, advance sales, and online orders. This is the easiest number to get, but it counts people who bought and never showed up.
- Tickets redeemed or scanned. Closer to actual foot traffic, as long as your staff scan reliably. If some entrances scan and others wave people through, this number will come in low.
- Member visits. Members usually don’t buy a ticket, so they won’t show up in sales totals. Whether member check-ins are captured, and how, depends on your front-desk process. If nobody records member entries, you can’t report them.
- Group and school visits. Group sales often record one order for 40 people. Make sure your report counts the people in the group, not the single order.
- Comps and event guests. Free passes, reciprocal members, and after-hours events. Decide whether they count, and write the decision down.
Most organizations report a total like “tickets redeemed + member visits + group headcount + comps,” and also break it out by category. Whatever you pick, keep the same definition from year to year. A jump in attendance that comes from changing what you count will eventually be noticed.
Start with the standard reports, then move to queries
Altru includes standard reports for sales and admissions activity, and for a quick monthly total they may be all you need. Run them for a period where you already know the answer, such as a day you counted by hand, and compare. If the numbers match, you have a baseline. If they don’t, find out why before anyone outside the team sees the report.
For anything more specific, such as counts by ticket type, by weekday, or by member versus non-member, use queries. A practical setup:
- A ticket query filtered to admission program(s) and a date range, returning visit date, ticket type or price type, quantity, and redemption status if your setup records it.
- A member visit query that pulls whatever your desk records when a member enters, with the visit date and membership level.
- A group sales query that returns the visit date and the headcount for each group, not the order count.
Filter on the visit date, not the order date. Advance purchases made in December for a January visit belong to January’s attendance. This is the most common reason two people get different totals from the same data.
If you’re not sure whether a field you need, like redemption status, can be queried in your version of Altru, test it on a short date range first, or ask Blackbaud support. Don’t assume it exists and design your whole report around it.
Calculating average visitation
“Average visitation” also needs a definition. These are the three most people mean:
- Average daily attendance = total visitors ÷ days open. Use days open, not calendar days, or closures and holidays will drag the average down. Keep a simple list of open days per month, because Altru won’t necessarily know when you closed for weather.
- Average by day of week or season. Group the visit-date results by weekday or month. This is the number that helps with staffing and setting timed-entry capacity.
- Average visits per member = member visits ÷ active members in the period. This only works if member entries are actually recorded. It’s useful for renewal conversations, since members who visit often tend to renew.
Query results can be exported, so the math is usually easiest in a spreadsheet. Export the query, build a pivot table by visit date and category, and add a separate column for days open.
Total annual visitors
Annual numbers end up in grant applications, accreditation paperwork, and the annual report, so you’ll want them to be defensible. A few habits help:
- Use your fiscal year if your funders do. Calendar-year totals and fiscal-year totals cause a lot of confusion when both are circulating.
- Record off-site and outreach audiences separately from on-site attendance. Many funders ask for both, and they’re easy to mix up.
- Save the exact query criteria with each year’s total, so next year’s report uses the same filters.
- Keep a short notes file listing known gaps, such as “scanner down for two weeks in August, counts estimated from sales.”
Make it a monthly routine
The teams that answer attendance questions quickly aren’t running clever reports. They run the same queries on the same day each month, paste the results into the same spreadsheet, and check them against the previous month. An annual total is then just twelve sums, and any odd number gets caught while people still remember what happened that month.
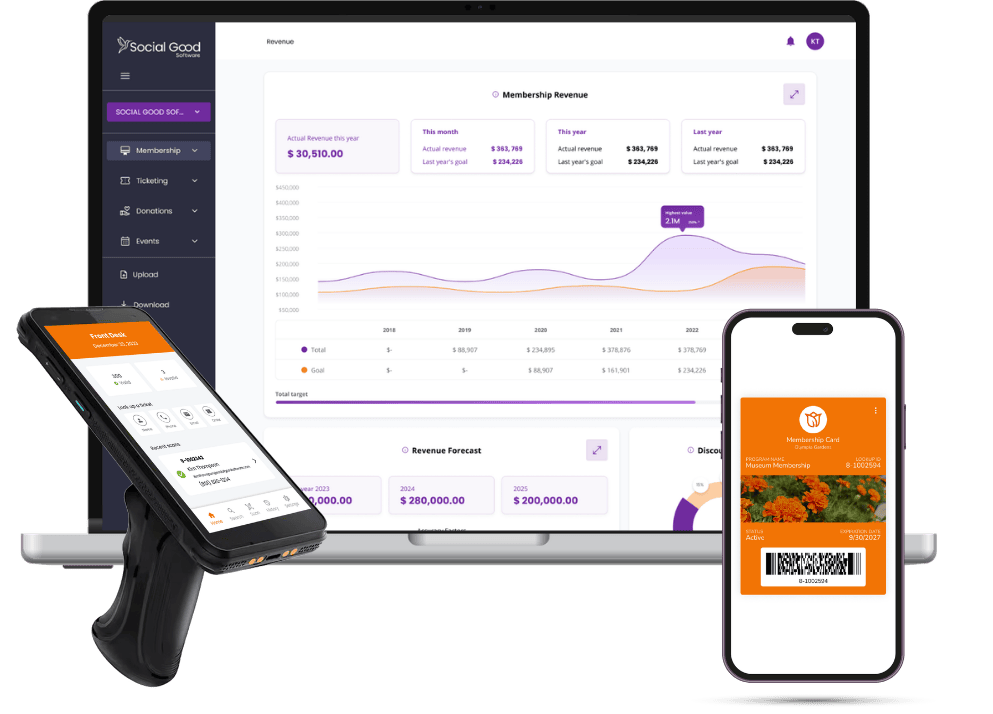
The part that tends to break down is the manual export, because it depends on one person remembering to do it. Social Good’s Data Bridge can sync Altru query results to Google Sheets, so an attendance query can feed a shared spreadsheet or dashboard without anyone exporting it each month. Altru still holds the data, and your definitions and query criteria still matter just as much.
Quick answers
Why doesn’t my attendance total match finance’s revenue report?
Usually because of dates. Revenue is recorded by transaction date and attendance should be counted by visit date. Free admissions, comps, and member visits also appear in attendance but bring in no revenue.
Can I report attendance by ZIP code?
Only for visitors you have a constituent record for, which usually means online buyers and members. Anonymous walk-up sales won’t have an address unless your desk asks for one.